Introduction
The purpose of this blog is to construct and analyze the performance of an in-house ESG index for the Chilean market. We were motivated to create this index due to the presence of an investment potential and the sparsity of ESG indexes currently available in the market.
In this blog, we discuss:
- Presenting the design of our in-house ESG-based index
- Analyze its performance against:
- Chile’s equity benchmark, the S&P IPSA Index
- ESG indexes with the same stock selection but with alternative weighting methods
Sustainable investments have been on the rise over the past few years, driven by growing interest from younger generations and increasing awareness on topics such as climate change, social unrest, and gender parity. Moreover, several studies have concluded that the integration of environmental, social, and governance (ESG) criteria into companies and portfolios enhances risk/return profiles.
Chile and Latin America have joined the race to create products and benchmarks to meet the demand for ESG investing. One important trigger has been the role that regulators have played. For instance, the Chilean Superintendencia de Pensiones (PS) published a norm stating that climate change risk and ESG must be incorporated into the investment policies and risk management for pension funds. This norm became effective on May 3, 2021, making it important for investors and fund managers to be aware of the characteristics, opportunities, and challenges of ESG investments.
Section 1: Construction of the Evalueserve Chile ESG (EVCHESGTR) Index
EVCHESGTR Index is a total return index designed to track the performance of Chilean companies that have a better ESG exposure relative to the broader market. Its index universe consists of constituents of the benchmark S&P IPSA (SPIPSATR) Index, which tracks the 30 largest and most liquid stocks listed on the Santiago Stock Exchange. For the index construction, we adopt a positive screening approach. The selected companies are “best in class” based on ESG metrics (as defined by an ESG score threshold). This approach results in a portfolio with better ESG features and is widely accepted in ESG investing strategies.
The Evalueserve Chile ESG Index rules are as follows:
- Index Universe: Constituents of the benchmark S&P IPSA Index
- Selection Criteria: Stocks with a Refinitiv ESG company score greater than 50 are selected, with a maximum cap of 20 stocks. Using Refinitiv scores to carry out the stock selection is dependent upon the availability of a sufficient amount of data to perform the analysis. The higher a company’s ESG score, the better it has performed in ESG criteria
- Base date and value: Base value of 1,000 on Feb. 28, 2017
- Currency: Chilean peso (CLP)
- Number of constituents: 20 or less. This would represent two-thirds of IPSA constituents when there are enough companies to meet the ESG threshold
- Weighting Criteria:
- If the maximum cap of 20 stocks meets the selection criteria, the constituent weights are based on the ESG ranking as follows:
Table 1: Constituent Weights
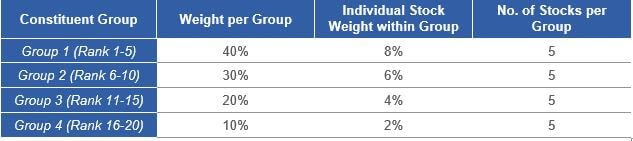
- When less than 20 stocks meet the selection criteria, the weighting criteria is modified as below:
-
-
- Number of stocks in Groups 1, 2, and 3 are calculated as “ROUNDDOWN (Number of Eligible Stocks/4,0)”
- All the remaining stocks are included in Group 4
- The stocks are equally weighted within each group
-
- Rebalance: Performed annually on the last Chilean business day of February
Section 2: Back-test Period – February 2017 to June 2021
In 2017, there were less than 10 constituents in EVCHESGTR Index; however, as more companies meet the selection criteria of a Refinitiv ESG score greater than 50, that number has been growing. In the February 2021 rebalance, 15 constituents qualified to join the index.
The market capitalization coverage of EVCHESGTR Index relative to the free float market value of SPIPSATR Index increased from 49% in February 2017 to 64% in February 2021.
Section 3: Performance of EVCHESGTR Index versus SPIPSATR Index
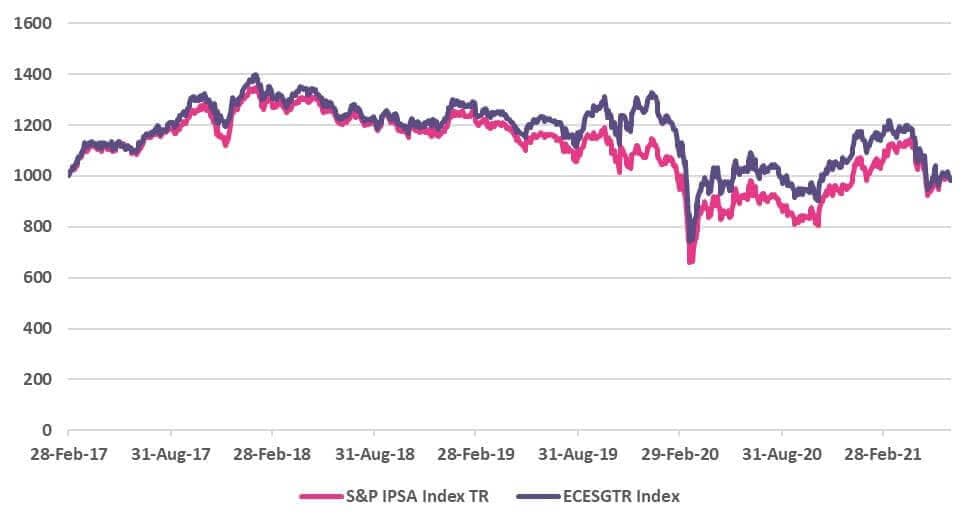
Figure 1 shows that the performances of EVCHESGTR Index and SPIPSATR Index were comparable during the period of analysis (Feb. 28, 2017 – Jun. 30, 2021). This result was in-line with findings from other markets and substantiated by an IMF study that suggests sustainable and conventional funds do not outperform or underperform their benchmark. The terminal value of EVCHESGTR Index was 985.46 compared with 993.45 for SPIPSATR Index.
Figure 1: EVCHESGTR Index vs. SPIPSATR Index (28 Feb 2017 – 30 Jun 2021)
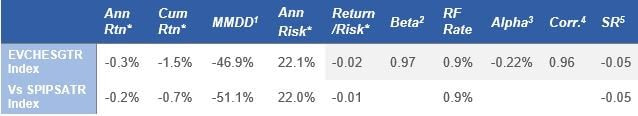
EVCHESGTR Index outperformed SPIPSATR Index from March 2018 to February 2021, as shown in Table 2. However, EVCHESGTR Index returns lagged those of SPIPSATR Index from March 2021 to June 2021. This also resulted in a decline of 1.5% in its cumulative return compared with a decline of 0.7% for the benchmark for the full period of analysis (see Table 3). EVCHESGTR Index had a better maximum drawdown relative to the benchmark.
Table 2: Annual Returns (as of 28 Feb Rebalance Date)
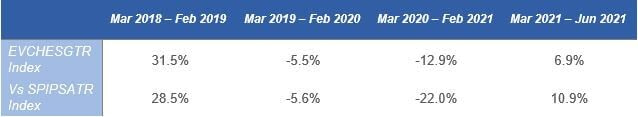
Table 3: Performance Metrics (Based on Monthly Data: 28 Feb 2017 – 30 Jun 2021)
Overall, the performance of EVCHESGTR Index and the benchmark is comparable.
Section 4: Performance of the Evalueserve Chile ESG Index versus alternative weighting methodologies
In this section, we expand our analysis to the choice of weighting methodology. For this, we compare the performance of EVCHESGTR Index, which uses weights based on ESG rankings, with the performance of the three alternative weighting methods for the same selection of stocks:
- Free float market capitalization (Mcap) weighted (FFMV_W)
- Equal weighted (EQ_W)
- ESG score weighted (ESGS_W): Weights are set using ESG Scores as follows
Constituent Weight = Constituent ESG Score / (Sum of ESG Scores in the index)
During the period of analysis, we find that EVCHESGTR Index outperformed the equal weighted (EQ_W) and ESG score weighted (ESGS_W) indexes. The performance of the free float Mcap weighted (FFMV_W) index was comparable to that of EVCHESGTR Index.
Figure 2: EVCHESGTR Index versus other weighting methods (28 Feb 2017 – 30 Jun 2021)
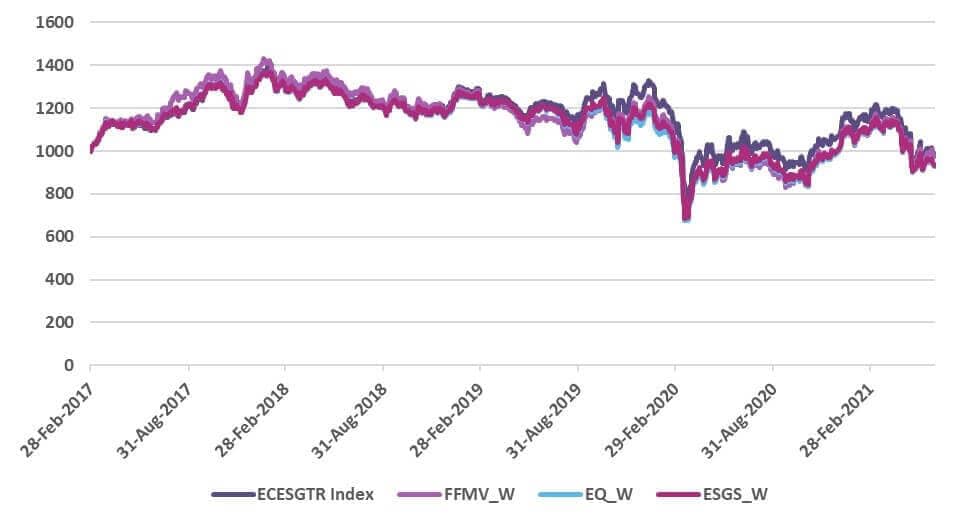
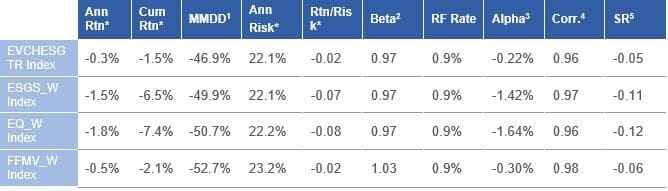
The performance metrics in Table 4 indicate that relative to the benchmark, EVCHESGTR Index had the higher alpha than the equal weighted (EQ_W) index and ESG score weighted (ESGS_W) index. EVCHESGTR Index also had a higher Sharpe ratio (SR), better risk/return ratio, and a better maximum drawdown. Compared with the free float Mcap weighted (FFMV_W) index, EVCHESGTR Index had a better risk profile, with lower volatility and better maximum drawdown.
Table 4: Performance Metrics (Based on Monthly Data: 28 Feb 2017 – 30 Jun 2021)
Conclusion
Our findings are encouraging for ESG investments, as the performance of the Chilean ESG-based index was comparable to that of its benchmark. This was also in-line with findings in other developed markets. While our analysis was limited to a 4.3-year period due to a lack of data for a longer-time series, we remain optimistic that the long-term performance trend of ESG indexes for the Chilean market will be similar to those of developed markets.
Furthermore, our analysis aims to contribute to the literature and support fund managers and index sponsors by providing alternative index designs using various weighting methodologies. To satisfy the growing preference of Chilean market participants that seek to invest responsibly, a reliable source of ESG scores for a larger set of companies will be the key to further research and development of ESG products.
Reference Notes:
- Figure 1, 2 & Table 2:Returns do not reflect management fees, transaction costs, or expenses. Indexes are unmanaged and cannot be invested indirectly. Past performance does not guarantee future results. Index returns are for illustrative purposes only. Benchmark SPIPSATR rebased to 1,000 as of the start date.
Table 3, 4: 1 Monthly Maximum Drawdown (MMDD): Maximum observed loss from a portfolio’s peak to trough. 2 Beta: A measure of the volatility, or systematic risk, relative to SPIPSATR.
3 Alpha: A measure of performance on a risk-adjusted basis. The excess return relative to SPIPSATR. 4 Correlation (Corr): A statistical measure of how SPIPSATR and EVCHESGTR move in relation to each other, which is calculated based on monthly returns. 5 Sharpe Ratio (SR): A measure of risk-adjusted performance. *Ann Rt: Annualized Return; Cum Rtn: Cumulative Return; Ann Risk: Annualized Volatility: Return/Risk: Annualized Return adjusted by Annualized Volatility.
Data Source: Refinitiv