Picture this: a global brand launches a product, backed by research that promised universal appeal. The result? One region embraces it enthusiastically, while another rejects it outright. The data seemed solid. The insights, foolproof. So, what went wrong? The culprit is often a silent disruptor: cultural bias in surveys.
Surveys form the backbone of market research, offering a window into consumer minds. But can they truly capture a universal truth? As cultural theorist Edward T. Hall observed, “Culture hides much more than it reveals, and strangely enough, what it hides, it hides most effectively from its own participants.” If culture can mislead its own people, how can researchers expect unbiased answers from diverse populations across the globe?
Every question we ask, every interpretation we make, carries the weight of cultural nuances—some obvious, others deeply embedded. Yet too often, these biases are overlooked, risking skewed data and misguided strategies. Are you unknowingly shaping questions that unintentionally exclude or alienate respondents?
Decoding Cultural Bias: What Lies Beneath
- What is Cultural Bias in Surveys? : Cultural bias arises when researchers rely on their own cultural assumptions, overlooking diverse perspectives. This is often evident in attitudinal questions that use 5-point or 10-point rating scales, which different cultures interpret differently. For example, some respondents may avoid extreme ratings, while others treat the midpoint as neutral. This creates disparities: open-ended responses may highlight concerns, while rating scales suggest everything is fine - producing a misleading picture.
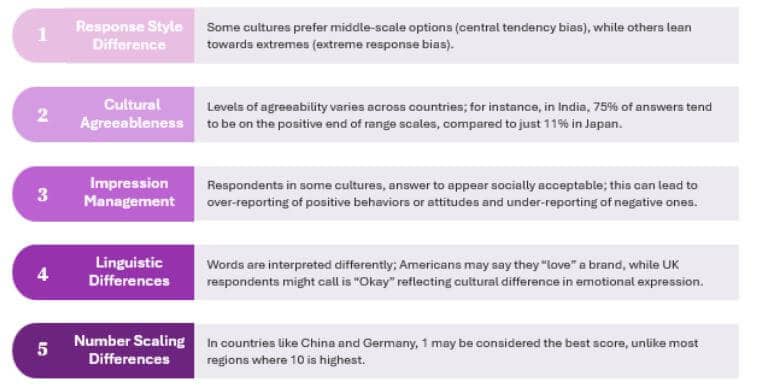
- The Roots of Bias: Why it happens: Cultural bias in survey rating questions can occur for several reasons, and here are some key reasons for cultural bias in these types of questions:
When Bias Took the Spotlight: A Comparative Analysis
Evalueserve’s client faced an intriguing puzzle: Why did customer satisfaction surveys from the LAC (Latin America and The Caribbean) region show high ratings but reveal significant dissatisfaction in feedback whereas the same is not observed in other regions like the Europe? Our analysis uncovered a cultural nuance that influenced how customers expressed their sentiments. By comparing responses from the LAC region with those from Europe, Evalueserve discovered a "generosity factor" at play in LAC region—where higher ratings didn’t always correlate with positive sentiment. This cultural bias led to an unexpected paradox, where dissatisfaction was masked by seemingly favorable scores, skewing perceptions of overall satisfaction.
Initially, Evalueserve hypothesized that customers in the LAC region might exhibit a more generous rating behavior than Europeans. This idea stemmed from prior observations and anecdotal evidence suggesting that cultural tendencies play a crucial role in shaping how customers approach survey questions. As our analysis progressed, our hypothesis proved true, shedding light on the complexities of how satisfaction is expressed across regions.
Evalueserve observed that in the LAC region, fewer customers rated their experience below 7 compared to Europe. However, this didn’t translate into a lower degree of negative sentiment. On the contrary, LAC customers expressed significantly more negative sentiments despite their relatively high ratings, highlighting a cultural reluctance to assign low scores. This phenomenon became even more evident in the way customers from both regions rated their experiences at a "7." While the proportions of "7" ratings were similar, LAC respondents exhibited markedly higher negative sentiment within this group. The disparity became more pronounced at the "8" mark, where many LAC customers with mixed or negative feelings still rated their experience as "8," possibly perceiving it as a neutral score.
The analysis of the "delighted" segment (ratings 8-10) revealed another key insight. In LAC, this group expressed significantly more negative sentiment compared to Europe, where higher scores strongly correlated with positive sentiment. This cultural generosity in ratings masked dissatisfaction, skewing perceptions of overall customer satisfaction in the region. The tendency of LAC customers to assign high scores, even when dissatisfied, underscored the importance of understanding cultural context when interpreting survey data.

To address such bias promptly, Evalueserve advises several actionable steps. First, we recommend simplifying the scale, by shifting to a 5-point system for easier interpretation and reduced cognitive load. With fewer options, respondents can make quicker, more confident choices, and marking (3) as a clear neutral point ensures clarity. Next, we advise the use of labeled scales to clearly define each point (e.g., “Very Dissatisfied” to “Very Satisfied”), reducing ambiguity and promoting more consistent responses. Finally, we propose the addition of visual cues, such as icons or visual indicators like smiley faces, alongside numeric scales. Research indicates that visual feedback mechanisms reduce regional response variations and improve consistency in pilot surveys by nearly 40%.

For a more comprehensive strategy to mitigate cultural biases, there are certain other additional measures as well, such as:
- Tailored Survey Content: Adapting questions and examples to resonate with specific cultural contexts ensures relevance and consistency while preserving the core intent of the survey.
- Open-Ended Feedback: Include optional open-ended sections for respondents to explain their ratings. This captures deeper insights and flags when cultural norms may influence numerical scores.
- Regional Data Normalization: Apply adjustments to survey data to account for regional rating tendencies, enabling fair comparisons of satisfaction levels across geographies.
Conclusion: Cultural Awareness as the Cornerstone of Reliable Surveys
In today’s globalized world, understanding cultural nuances in surveys is not optional—it’s essential. Surveys that ignore cultural diversity risk delivering skewed insights, alienating respondents, and compromising decision-making. On the other hand, culturally attuned survey designs unlock richer, more accurate data, ensuring voices are authentically represented.
By designing surveys that embrace cultural sensitivity, researchers can ensure insights reflect the true voices of their audiences. Tailoring questions to resonate with specific cultural contexts, reducing cognitive biases with simpler scales, and integrating open-ended feedback options all contribute to more accurate and actionable data.
At Evalueserve, we bridge cultural gaps with expertise, crafting surveys that resonate with local audiences while minimizing bias. By tailoring questions to reflect regional norms, addressing language nuances, and embedding inclusivity at every step, we empower organizations to gather reliable, actionable insights.
Cultural sensitivity transforms surveys from mere data collection tools into instruments for impactful decision-making. Partner with Evalueserve to unlock the full potential of culturally attuned survey research and build strategies that deliver real, sustainable results.
Talk to One of Our Experts
Get in touch today to find out about how Evalueserve can help you improve your processes, making you better, faster and more efficient.


