In our previous blog, we looked at how remote working, and, consequently, the demand for external engagements, would surge in a post-COVID-19 world. We now note that most organizations have already recognized digital transformation as a strategic advantage. Those at the forefront of this trend will have an edge over others in adopting remote working. Physical location is no longer a limitation in opting for a borderless workspace.
In this blog, we set out to test our hypothesis by tracking the returns of companies that facilitate remote working. These companies have been classified under three themes as follows:
- Cloud Computing and Services – Companies that deliver on-demand services over the internet, including data storage and business support and applications/software related to cloud-based data analytics, HR management, tax management, etc.
- Online Collaboration Tools – Companies that provide remote communication tools and services to ensure businesses run smoothly. These include providers of services and software for holding online meetings and those that provide access to work data and office systems and software via virtual desktops.
- Cybersecurity – Companies that provide protection from the key risks of cyber-attacks, data leakage, and fraud. Security is a major concern while working remotely. According a report from the cybersecurity firm, Kaspersky, incidents of cyber-attacks have increased significantly in 2020 during the COVID-19 crisis. Businesses have therefore developed comprehensive plans for information security, data recovery, and business continuity to manage these threats. These plans require:
- Virtual private networks (VPNs),
- Multi-factor authentication (MFA) software, and
- Cybersecurity tools.
Evalueserve’s Work-from-Anywhere Index
Our Work-from-Anywhere Index (EWFAUSTR) is a total return index designed to track the performance of US companies that are expected to benefit from a higher demand for telecommuting-related services.
An overview of the index methodology is as follows (the complete methodology document is available upon request):
- Index Universe
- Common stocks and ADRs listed in US exchanges and classified under the GICS Software & Services industry group
- Selection
- Market Capitalization: Minimum free float market capitalization of USD 1 billion
- Liquidity: Minimum six-month average daily traded value of USD 5 million
- Revenue Derived from Themes: A minimum of 75% of total revenue deriving from sales related to any of the themes – cloud computing and services, online collaboration tools, or cybersecurity.
- Stock Selection: Top 10 stocks from each theme based upon market capitalization
- Weighting
- Equally weighted
- Rebalancing
- Annual
- Calculation Methodology:
- Based upon a standard divisor
The Performance of EWFAUSTR versus Its Benchmark -S&P Software & Services Select Industry Index TR (SPSISST)
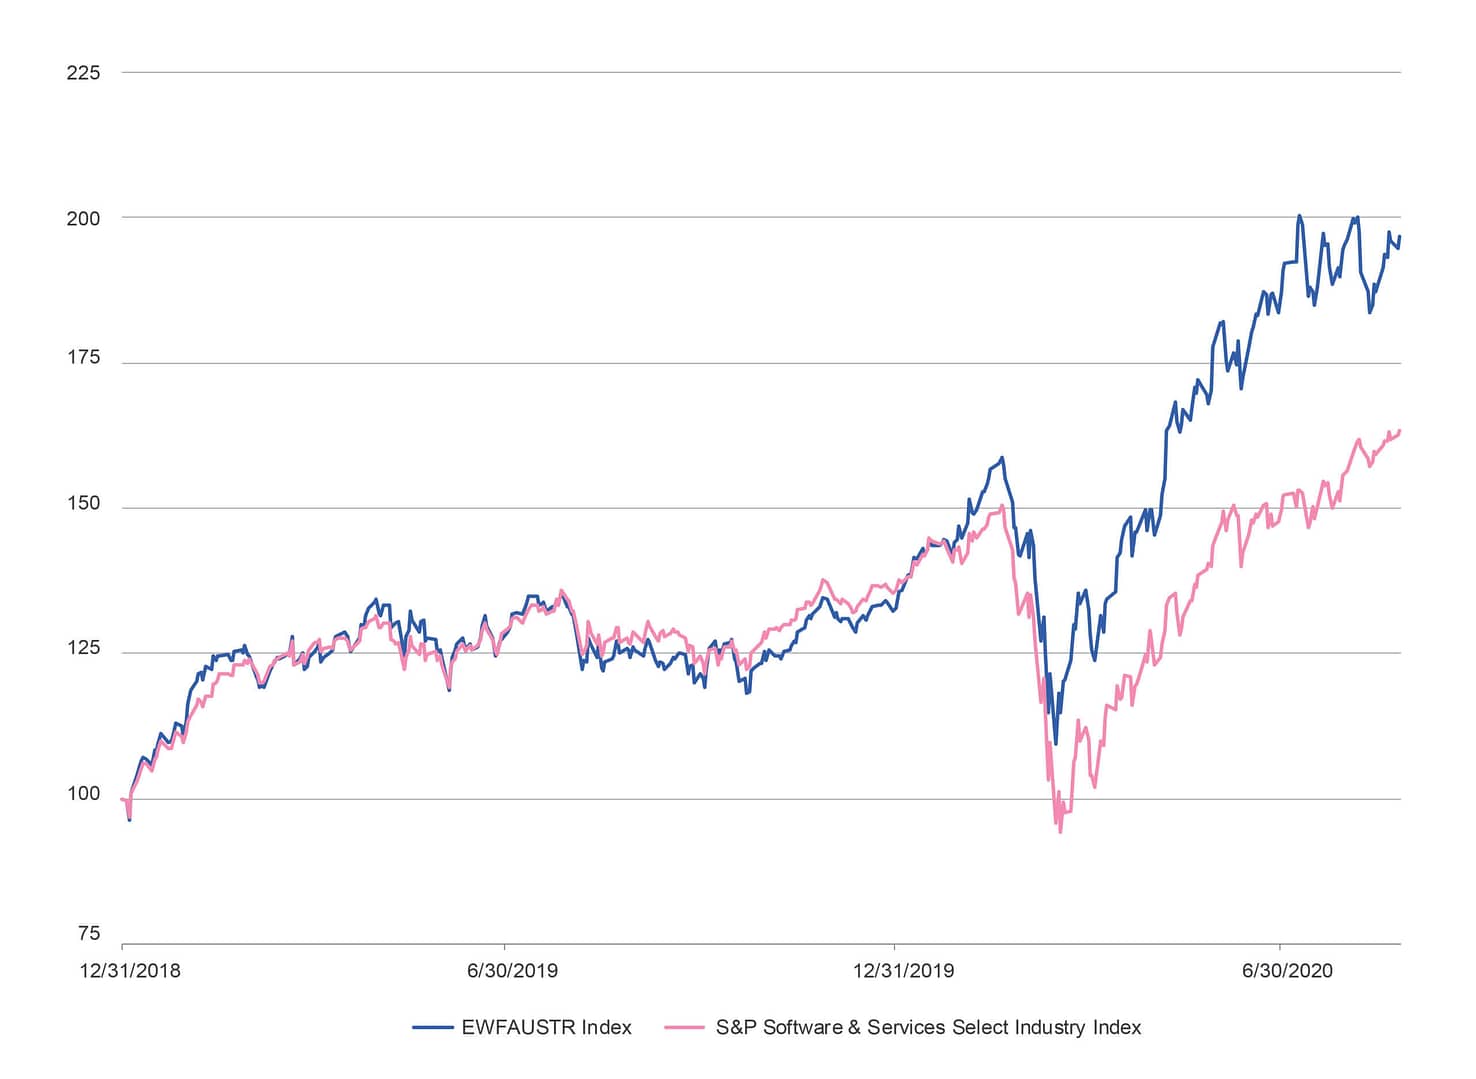
The following chart shows that the EWFAUSTR outperformed the SPSISST by 33.42% from December 2018 to August 2020, with the EWFAUSTR having a terminal value of 196.81 at the end of the period studied versus the SPSISST at 163.39.
EWFAUSTR Index vs SPSISST (31Dec 2018 – 25 Aug 2020)
Note: Returns do not reflect management fees, transaction costs, or expenses. Indices are unmanaged and cannot be invested in directly. Past performance does not guarantee future results. Index returns are for illustrative purposes only.
The table below displays how the EWFAUSTR had a positive alpha relative to the SPSISST in the pre-COVID-19 crisis period. It had a beta of less than 1. It also fared better during the period studied on parameters such as the Sharpe ratio, downside capture, and risk.
Performance Metrics Pre-COVID crisis (based on Monthly data – 31 December 2018 – 31 January 2020)

Note: 1 Alpha: – A measure of performance on a risk-adjusted basis. The excess return relative to SPSISST. 2 Beta: A measure of the volatility, or systematic risk, relative to the SPSISST. 3 Correlation: A statistical measure of how the SPSISST and the respective index move in relation to each other. Calculated based on monthly returns. 4 Sharpe Ratio: A measure of risk-adjusted performance. 5 R2: Calculated based on monthly returns. 6 Upside Capture: A measure of performance relative to the SPSISST during periods of positive returns for the benchmark. 7 Downside Capture: A measure of performance relative to the SPSISST during periods of negative returns for the benchmark. 8 Maximum Drawdown – maximum observed loss from a peak to a trough of a portfolio
Looking at the relative performance of the EWFAUSTR versus the SPSISST during the COVID-19 crisis, it was even better compared with the pre-COVID-19 crisis period, outperforming on all parameters including the Sharpe ratio, upside capture, downside capture, and maximum drawdown.
Performance Metrics during the COVID-19 Crisis (based on monthly data – 31 January 2020 – 31 July 2020)

Note: 1 Alpha: A measure of performance on a risk-adjusted basis. The excess return relative to SPSISST. 2 Beta: A measure of the volatility, or systematic risk, relative to the SPSISST. 3 Correlation: A statistical measure of how the SPSISST and the EWFAUSTR move in relation to each other and that is calculated based on monthly returns. 4 Sharpe Ratio: A measure of risk-adjusted performance. 5 R2: Calculated based on monthly returns. 6 Upside Capture: A measure of performance relative to the SPSISST during periods of positive returns for the benchmark. 7 Downside Capture: A measure of performance relative to the SPSISST during periods of negative returns for the benchmark. 8 Maximum Drawdown: Maximum observed loss from a portfolio’s peak to trough.
This pandemic has been a tech-opener, which leads us to expect that companies providing technology and services that support the trend in telecommuting will only continue to perform well.
For more information on developing custom indices, talk to one of our financial services experts.


