Apples to Apples: ESG Data Comparability
In ancient times, few sailors ventured out into the open sea. Instead, most sailed within sight of land to keep their bearing and know their location. Not until they established fixed points like constellations of stars to mark their positions could they navigate and traverse the oceans. Similar is the story of ESG data. Today, ESG is a remarkably heterogeneous space with various data providers, frameworks, regulations, and practices. The ESG data market is also expanding quickly as to maturity and usage. ESG data providers generated revenues of more than $1 billion in 2021 and are forecasted to reach $1.3 billion in 2022.1 Yet, like these mariners of old, for those trying to navigate the growing sea of ESG data, there are few fixed points that allow for meaningful comparison.
For example, imagine analyzing the Net Zero Transition plans of four major US banks – Citigroup, JP Morgan Chase, Morgan Stanley, and Goldman Sachs. In reviewing the available information, it becomes apparent that ESG data comparability has a long way to go before reaching the equivalence of financial statements. As shown in Figure 1, the sectors/business segments covered by each bank for their Net Zero strategy differ considerably, making the baseline data and their progress incomparable. For instance, it is difficult to determine which of the target-setting scenarios (each with its own rationales) used by these banks is the most prudent. Citigroup appears to provide the most complete disclosures of these institutions, allowing for progress comparison against the lending commitment intensity of Morgan Stanley and the physical intensity of JP Morgan Chase and Goldman Sachs. However, drawing comparisons across JP Morgan Chase, Morgan Stanley, and Goldman Sachs would be nearly impossible given the difference in reporting. However, making an investment decision based solely on these disclosures will unlikely yield an outcome aligned with sustainable investing objectives.
As this example suggests, ESG data comparability requires context and narrative, not more data. The comparability of ESG data remains a significant challenge, leaving many questions about companies’ progress toward sustainability goals and targets. As the nature and extent of reported ESG data expands, several substantial hurdles remain if one wants to draw comparisons across companies and sectors.
|
|
Citigroup
|
JP Morgan Chase
|
Morgan Stanley
|
Goldman Sachs
|
|
|---|---|---|---|---|---|
|
Type of target
|
Absolute reduction
|
Intensity reduction
|
Intensity reduction
|
Intensity reduction
|
Intensity reduction
|
|
Emission Scopes covered
|
1+2+3
|
1+2
|
3
|
1+2+3
|
1+2+3
|
|
Sector covered
|
Energy (Integrated oil & gas, oil & gas exploration & production, oil & gas storage & transportation, oil & gas refining & marketing, oil & gas equipment, services and drilling and commodity traders)
|
Oil & Gas (Exploration, production, oilfield services and other oil and gas)
|
Oil & Gas (Exploration, production, oilfield services and other oil and gas)
|
Energy (Integrated oil & gas, oil & gas exploration & production, oil & gas storage & transportation, oil & gas refining & marketing, oil & gas drilling, oil & gas equipment & services)
|
Oil & Gas (no definition)
|
|
Reduction targeted
|
29%
|
35%
|
15%
|
29%
|
17%-22%
|
|
Baseline year
|
2020
|
2019
|
2019
|
2019
|
2019
|
|
Baseline value
|
143 million MT Co2
|
5.3 grams CO2e/MJ
|
66.5 grams CO2e/MJ
|
1,839 tons of Co2 equivalent per million dollars of lending commitment
|
72 grams CO2e/MJ
|
|
Target year
|
2030
|
2030
|
2030
|
2030
|
2030
|
|
Net Zero scenario used
|
Absolute IEA (International Energy Agency) NZE (net zero emissions) 2050 emissions
|
IEA SDS (Sustainable Development Scenario) with methane
|
IEA SDS with adjustments for nonenergy oil and natural gas demand
|
Absolute IEA (International Energy Agency) NZE (net zero emissions) 2050 emissions
|
Goldman Sachs Carbonomics 1.5°C net zero path which is in line with the IPCC AR6
|
Figure 1. GHG Disclosures of Major US Banks
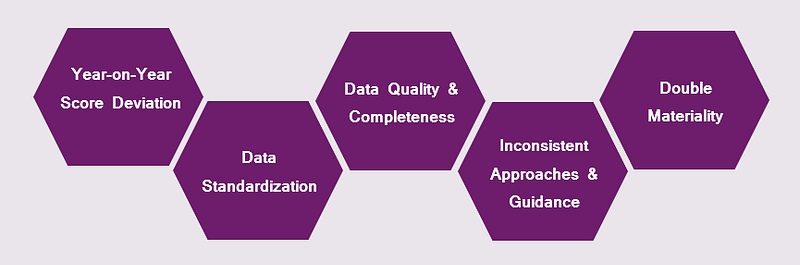
Data quality and completeness is a major challenge in the ESG data market as, despite increasing data availability, significant gaps still exist. Unlike financial reporting, which has predetermined variables in a company’s balance sheet and income statement, there is no such uniform reporting mechanism in ESG reporting. A prime example is Scope 3 emissions data, especially for SMEs, where data vendors tend to rely on estimations and proxy data derived from industry averages and eventually tend to dilute its quality because they are not entirely accurate. In estimating financed emissions, most banks use a methodology drawn up by the Partnership for Carbon Accounting Financials (PCAF). Other approximation techniques for Scope 3 estimations are Input-Output Models and a Lifecycle Analysis approach.
Data standardisation is another area of critical need. ESG data vendors use corporate disclosures to back up their ratings and scores, which requires significant harmonization since different jurisdictions have different asks from corporates operating in their territories. As a result, this makes international comparisons complicated. For example, for safety-related data points, some companies disclose raw numbers (e.g., the number of incidents), and some disclose a relative number where the base varies from company to company (e.g., injuries per unit of hours/days worked). In contrast, others will provide a percentage scale (e.g., lost time incident frequency. Based on Evalueserve’s experience with ESG data, these differences can make it difficult for an ESG ratings agency to ensure consistency and comparability in the data used in generating an ESG score.
Inconsistent approaches and guidance by data providers are a widespread source of frustration. Firms place different levels of importance on the broad categories of E, S, and G, resulting in drastically different ratings from vendors of the same company. For example, an ESG ratings vendor might penalise or reward a company depending on whether the disclosure can fit into their specific methodologies. In cases where data is missing, providers typically apply different rules. Imagine a situation where Provider 1’s approach is to take the industry average as a proxy, but Provider 2’s approach is punitive, wherein they assume no value at all. Both service providers have rationales to support their methodologies, but this makes direct comparison difficult and faulty. Therefore, understanding the ins and outs of a prospective investment is crucial for decision-focused comparison.
Double Materiality is another highly debated concept in the ESG space where rating providers can offer divergent views. Double Materiality refers to how the information disclosed by a company can be material in terms of its implications for the company’s financial value and its impact on the world at large. For instance, one rating agency’s approach may seek to capture the company’s impacts on the environment and society when assessing its climate change disclosures. However, another provider may take a more limited view, looking solely at the potential impact on the shareholders and the impact on the company’s development, performance, and position.
The example of Chevron Corporation illustrates the potential for significant divergence in ESG ratings from different providers.2 Sustainalytics gave Chevron an ESG ranking of 43.0 for 2022, placing it in the “severe/high risk” category. MSCI, on the other hand, gave Chevron a ranking of 4.2 to 5.7, placing it in the “average” band. These very different outcomes for the same company result from each provider’s specific approach and methodology. MSCI’s rating is influenced by its criteria, which prioritizes environmental factors over social and governance factors. Sustainalytics, on the other hand, considers a broader range of factors, with a more equal weighting across all three dimensions of ESG. This difference in methodology is reflected in the specific factors that each provider considers when evaluating Chevron. For example, MSCI recognizes Chevron’s efforts in disclosing environmental data, implementing emission reduction targets, and engaging in stakeholder engagement. Sustainalytics also considers these factors, but it also examines Chevron’s carbon intensity, oil spills, involvement in controversial projects, executive compensation, and lobbying activities.
This divergence in ESG ratings among different providers can create confusion for investors trying to assess a company’s ESG performance. Indeed, in practice, many investors need to subscribe to multiple ratings providers to ensure they have a well-rounded understanding of a company’s ESG performance.
Year-on-year score revisions present a further challenge where one sometimes finds notable deviations in a company’s ESG rating from one year to the next as offered by the same ratings provider. A study conducted in 2021, which reviewed the ESG scores provided by a major ESG ratings provider between 2018 and 2020, found that the same ESG dataset covering the same set of companies had varying scores at different times. Upon downloading and analyzing the data, not a single ESG score was the same when viewed at separate points in time. The variation was due to subsequent reconciliations by the provider in its scoring methodology between the two years being compared.3 This rewriting of historical data by providers is an ongoing process to improve the efficacy and relevance of their data and by streamlining their methodologies from time to time. Problematically, however, retrospective score rewrites can significantly change companies’ ESG scores, undermining their utility to investors making investment decisions based on this information.
Efforts at ESG Standarization.
There is a growing push to enhance the consistency of ESG data and make it more comparable. Specifically, efforts are underway to align the various ESG reporting frameworks such GRI, SASB, and TCFD to harmonize the requested data. This past June, the International Sustainability Standards Board (ISSB) introduced the first Sustainability Disclosure Standards – IFRS S1 and IFRS S2 – hoping to bring greater clarity to corporations and investors navigating multiple jurisdictions. Working in collaboration with regulators worldwide, ISSB aims to create a unified “global baseline” for sustainability disclosures, which will come into effect on January 1, 2024. The standards focus on establishing a common language for disclosing ESG risks and opportunities while aligning the timeline for sustainability disclosures with financial disclosures to highlight their equal importance for issuers. Under IFRS S1, companies must disclose sustainability risks and opportunities over short, medium, and long terms. Meanwhile, IFRS S2 specifies reporting on climate-related risks and opportunities. Both standards fully incorporate TCFD recommendations, and the ISSB hopes to include Scope 3 GHG reporting under the mandate in the next two to three years.
The ESG environment is constantly evolving, and ESG data reporting is struggling to keep pace. While efforts are underway to standardize reporting, such as the recent ISSB standards, users must continue navigating the complex ESG data landscape, mindful of the many challenges with reported data and ratings. Traditional approaches and tools cannot yield apples-to-apples ESG data comparability, nor is more data a solution if the underlying problems remain. To make informed decisions about a company’s ESG performance, it is essential to consider additional context, such as industry benchmarks, supply chain practices, and overall sustainability strategy.
Context is critical in drawing meaningful comparisons and enabling a complete view, allowing investors and companies to gauge ESG performance, view trends, and update policies and strategies accordingly. This approach demands both the tools to capture the available data and the expertise and industry knowledge to give the narrative to understand sustainability efforts, like net zero transitions. In short, to fully understand and make meaningful comparisons of ESG data, we must move beyond traditional approaches and tools and embrace a context- and narrative-driven approach.
Context and narrative allow us to:
- Understand the “why” behind the data. ESG data points can be misleading if one doesn’t understand the context in which they were collected and reported. For example, a company with a high ESG score may have a significant environmental impact due to its supply chain.
- Identify trends and patterns. By comparing ESG data over time and across different companies, we can identify trends and patterns that would be difficult to see from individual data points. For example, one might see that a particular industry is making significant progress in reducing its carbon emissions, while another industry is lagging.
- Make informed decisions. Context and narrative help interpret ESG data more meaningfully and make informed decisions about investments and capital allocation. For example, investors might decide to invest in a company committed to reducing its environmental impact, even if it has a lower ESG score than its industry peers.
By embracing a context- and narrative-driven approach to ESG data comparison, we gain a deeper understanding of how companies are performing on ESG issues and make more informed decisions about where to invest our time and resources.
Contributors

Roshni Chhabra
Principal Consultant

K.P. O’Reilly
Group Manager, Solutions Architect

Aaron Morales
Vice President
Publication
Download the publication
For more information please contact: ESGsolutions@evalueserve.com