The performance of factors in the US and other developed markets have been widely studied. The seminal Fama-French three-factor model (1992) has been extended over time into six factors: value, momentum, size, quality, low volatility, and dividend yield. Jegadeesh and Titman confirmed the outperformance of momentum in US stocks. Similarly, outperformance of low volatility as a factor in stocks globally has been studied by Baker and Haugen. In fact, this phenomenon has been termed “low‑volatility anomaly” – as it contradicts the capital asset pricing model (CAPM), in which higher returns correspond to higher risk. In this blog, we explore if such a phenomenon exists in Latin American markets as well.
Apart from an academic perspective, the study of investment return factors is useful for the fund management industry as well. Factor investing is a strategy in which stocks are selected based on attributes that are hypothesized to yield higher returns relative to the broader market. Several indices and ETFs have been developed to track these factors. Factor investing also forms the core of smart beta products, which have become popular in the ETF industry, with an estimated USD 800 billion in assets under management.
In our previous blogs, we have looked at the performance of the low-volatility factor in the Chilean market for the period between 2005 and 2018, both with and without trading costs. The results confirmed outperformance of the factor relative to the benchmark IPSA index. We extended this analysis to six Latin American countries – Colombia, Chile, Peru, Brazil, Argentina, and Mexico. We used price return indices, without dividends, trading costs, and fees, in the analysis.
For our analysis, we created low-volatility price return indices across the six LatAm countries as follows:
Methodology: Each index consists of eight stocks selected from the universe of stocks in their respective benchmark indices and is rebalanced on a quarterly basis. The index selects the eight least-volatile stocks, based on volatility (measured as a standard deviation of daily returns annualized using 252 business days) shown over the previous quarter. The constituent stock weights are inversely proportional to volatility.
Data: We used the historical index composition in Reuters to show the index levels from January 1, 2006, to May 28, 2019, for all countries except Colombia and Peru. Benchmark prices were taken from Yahoo Finance’s API using Python. We also used Python to define stock eligibility, find the least volatile stocks, define their weight, calculate index levels, and create charts.
The graphs below depict the performance of low-volatility indices compared with their respective benchmarks.
Low-Volatility Price Return Indices and Their Benchmarks in LatAm
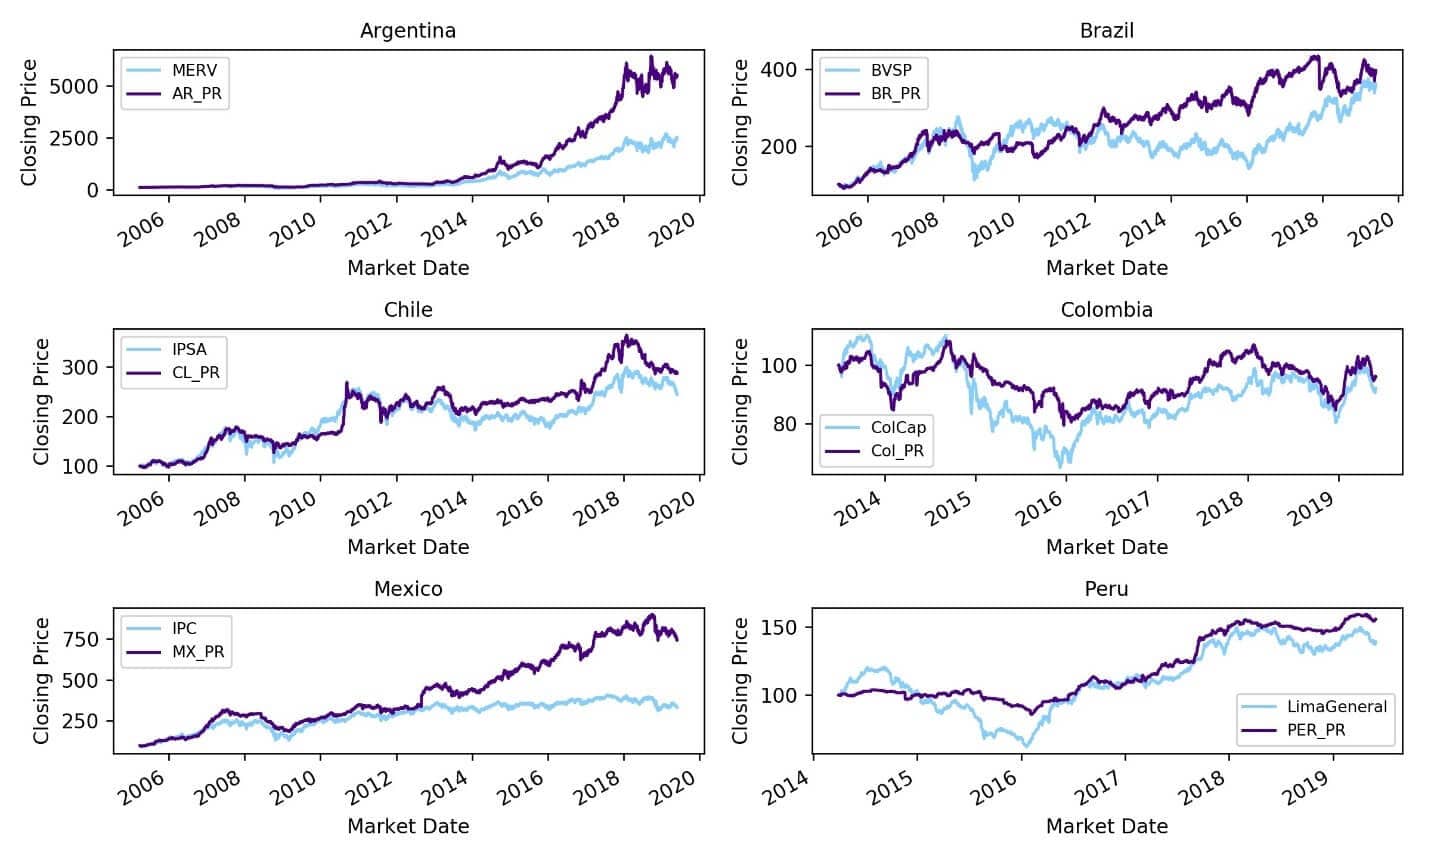
Source: Yahoo Finance. Every price return index ends with “PR” for each country. Benchmarks have the name used by the exchange for every country. Returns do not reflect management fees, transaction costs, or expenses. Indices are unmanaged and cannot be invested in directly. Past performance does not guarantee future results. Index levels were rebased to 100 as of March 2005 for all countries except Peru and Colombia, which were rebased as of March 2014 and June 2013, respectively. Indices were calculated until May 2019. Index returns are for illustrative purposes only.
The results confirm the existence of the low-volatility anomaly in the LatAm markets and are in-line with Baker and Haugen’s analysis, which showed outperformance of such strategies globally. There is a consistent outperformance of the factor against the broader market benchmarks over the long term – i.e., 15 years for all markets (except for Peru and Colombia, where we used a five-year time series).
It is interesting to note that conservative strategies, almost by definition, are expected to underperform, especially during normal periods or periods with low volatility. A more remarkable feature is that the performance across countries was better following the 2008 crisis.
The performance of benchmark indices since the sub-prime crisis shows that turmoil caused by insolvency as well as trade and political disruptions adversely affected the equity markets. Therefore, strategies that are profitable but have less exposure to volatility should be considered. As we can see from the previous charts, there is a smoother variation on low‑volatility indices during and after the crisis for those countries with data before 2008.
The following table compares the performance measures for the low-volatility price return indices analyzed. It shows that countries such as Mexico and Argentina have been experiencing strong returns, despite their high levels of risk. The risk-adjusted return measured by the Sharpe ratio was more than 50% in all countries, except for Colombia.
Low-Volatility Price Return Index Sharpe Ratio

Source: Yahoo Finance. Index levels were rebased to 100 as of March 2005 for all countries except Peru and Colombia, which were rebased as of March 2014 and June 2013, respectively. Indices were calculated until May 2019. Index returns are for illustrative purposes only. Index performance returns do not reflect management fees, transaction costs, or expenses. Indices are unmanaged and cannot be invested in directly. Past performance does not guarantee future results.
On a relative basis compared to their benchmarks, the low-volatility indices had a better risk-adjusted return, measured by the Sharpe ratio, in all of the countries. The following graph compares Sharpe ratios of low-volatility price return indices and their respective benchmarks.
Sharpe Ratio Comparison – Low-Volatility Price Return vs. Benchmarks

Source: Yahoo Finance. Index levels were rebased to 100 as of March 2005 for all countries except Peru and Colombia, which were rebased as of March 2014 and June 2013, respectively. Indices were calculated until May 2019. Index returns are for illustrative purposes only. Index performance returns do not reflect management fees, transaction costs, or expenses. Indices are unmanaged and cannot be invested in directly. Past performance does not guarantee future results. The Sharpe ratio for Colombia’s benchmark was negative during the period studied, so we set it to zero since a negative ratio does not convey any useful meaning.
Overall, we believe the low-volatility anomaly exists in LatAm capital markets, offering outperformance against benchmarks, and warrants further research. More research on other factors is also expected to yield valuable insights into market performance. Such research could be used to support the development of suitable investment strategies that outperform broader markets. Based on insights from this investigation and previous research, we plan to extend our research to other factors and facilitate the development of factor investing in this region.
For more information on developing custom indices or the potential of tools like Python, talk to one of our financial services experts.


